This video showing how application 9_A_2 works in C#.
The form is composed by:
- a buttons;
- 6 label;
- 3 trackBar
- a comboBox;
- a pictureBox.
Through the trackBars it is possible to choose the distribution parameters and through the comboBox the type of distribution to be displayed. When the “Start” button is pressed, the corresponding distribution graph and two histograms, the final one and the one selected at the moment, will be shown in the pictureBox.
This video showing how application 9_A_1 works in C#.
The form is composed by:
- a buttons;
- two label;
- a trackBar;
- a pictureBox.
After choosing how many points to generate, by pressing the “Start” button the trend of the Empirical CDF and the Theoretical CDF will be shown in the pictureBox. As the number of points increases, we will see that the two gradually become the same.
This video showing how application 6_A works in C#.
The form is composed by:
- a buttons;
- nine label;
- a comboBox;
- four trackBar;
- a pictureBox.
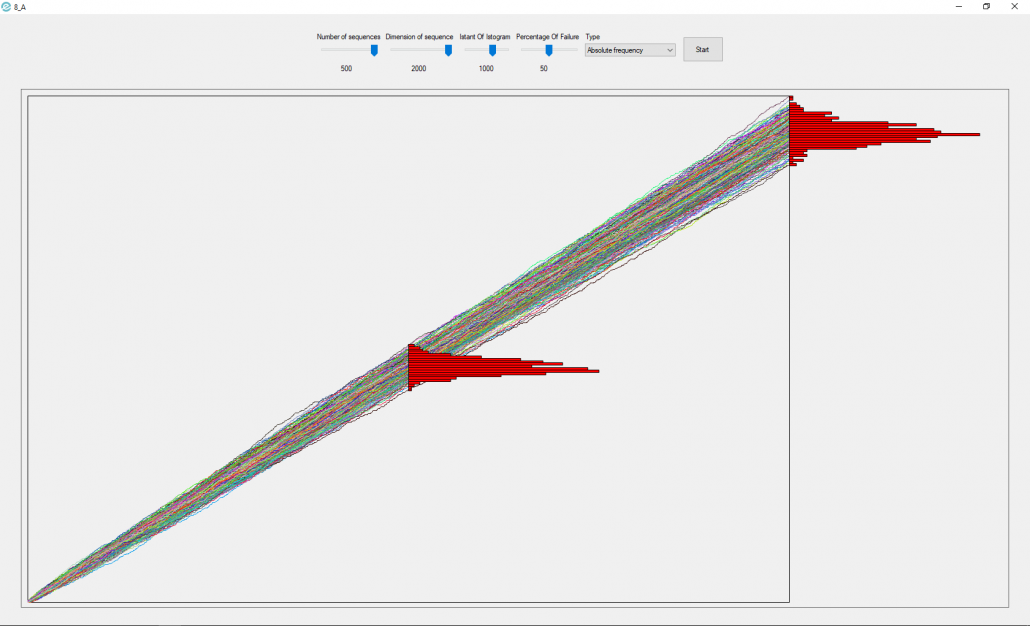
In the upper part of the window we can set the parameters of the number of sequences (m), of the number of points (n), of the sampling instant (t), of the failure percentage (p).
Once these parameters have been set, you can choose the type of data to be shown in the histograms. Pressing the “Start” button will generate m sequences made up of n points and shown in the pictureBox.
Absolute frequency
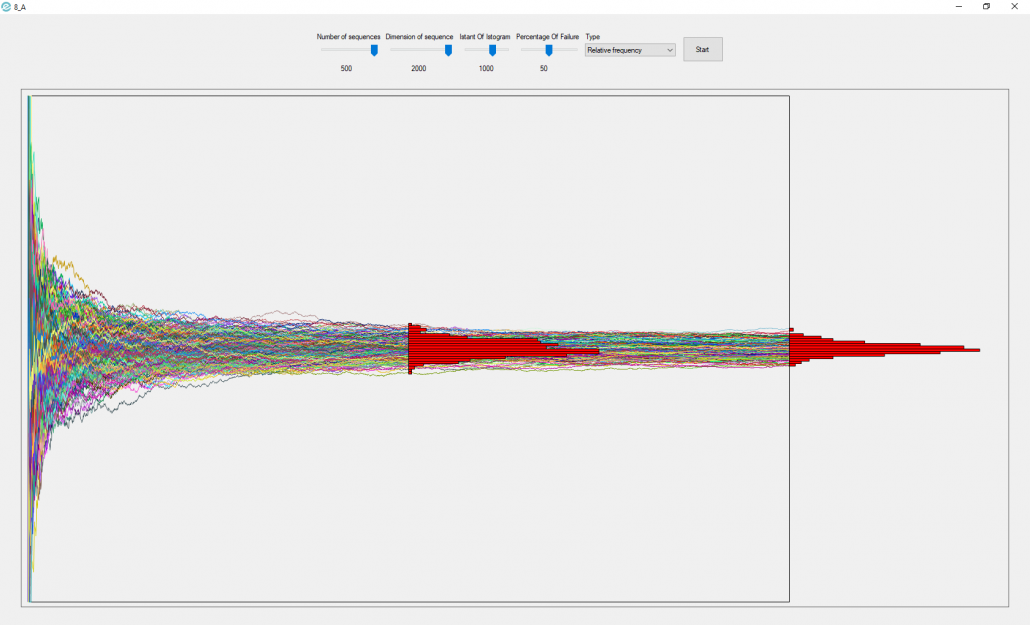
Relative frequency
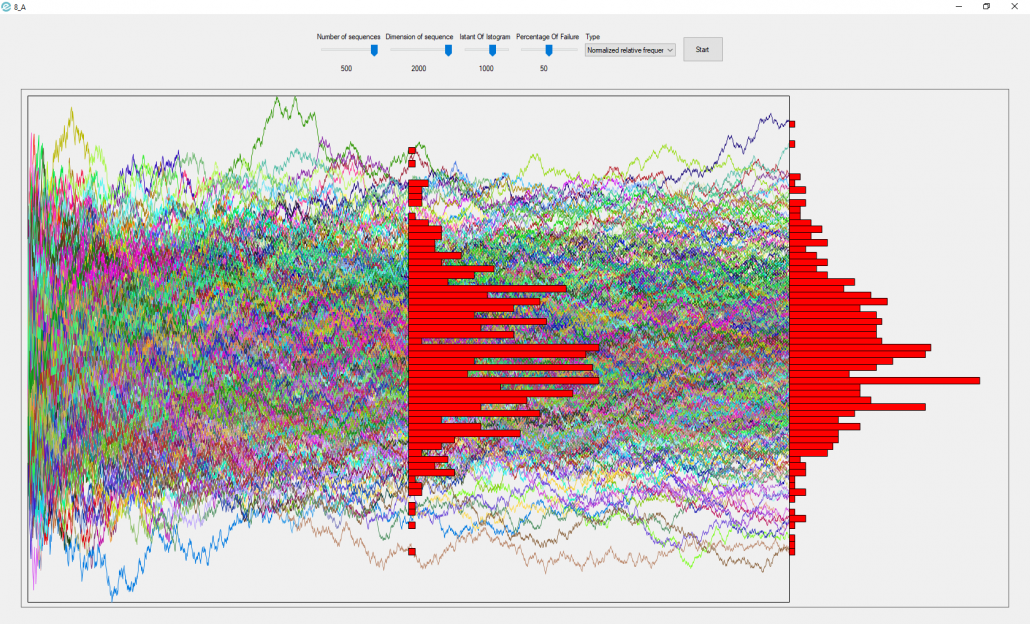
Normalized relative frequency
As we can see in the pictures, for what regards absolute frequency, with n->∞ we will have a shape that tends to zero at the tails, so it is a degenerate form.
For what concerns the relative frequency, with n->∞ we will have that ni(number of success)/n will tend to p(where p is the probability of success), and the other values will be 0 because there will be a finite number over infinity, so we will have a peak in p and it is also a degenerate form.
The normalized relative frequency, instead, is the only shape that doesn’t degenerate, and for n->∞ it tends to the normal distribution with the “bell” shape.
This video showing how application 7_A works (in C#).
The form is composed by:
- a buttons;
- a label;
- a richTextBox;
- a textBox;
- a pictureBox.
- a openFileDialog
Pressing the “Load” button the data from the CSV file specified in the textBox are loaded and will appear in the richTextBox.
The scatterplot, two histograms and linear regression will be drawn in the pictureBox.
This video showing how application 6_A works in C#.
The form is composed by:
- a buttons;
- a label;
- a richTextBox;
- a textBox;
- a pictureBox.
Pressing the “Load” button the csv file will be loaded and the graphs will be generated.
This video showing how application 1_A works (in both C # and vb-net).
The form is composed by:
- a buttons;
- a TextBox;
- a pictureBox.
Pressing the “Show word cloud” button the .txt file specified in the textBox is loaded, the words with higher frequency in the text differentiated by size and color are printed in the pictureBox.
This video showing how application 1_A works (in both C # and vb-net).
The form is composed by:
- a buttons;
- two label;
- two textBox;
- a richTextBox.
Pressing the “Load CSV” key the .csv file specified in the textBox is loaded, its content is printed in the richTextBox and finally, the mean, the standard deviation and the distribution are displayed.