
In application 13_A we simulated the following random variables
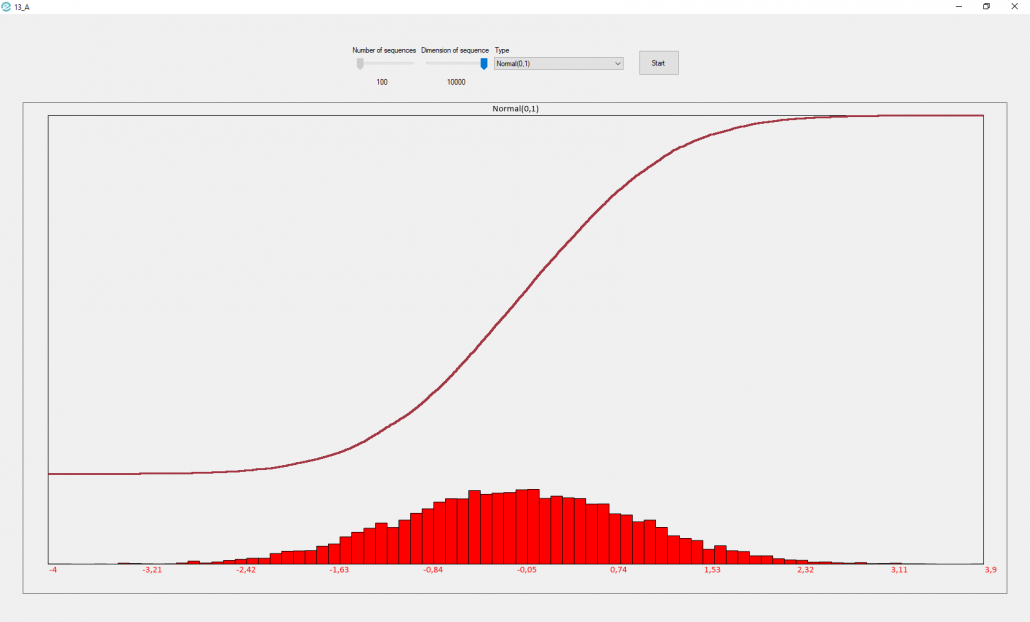
The first image represents the normal distribution with mean 0 and variance 1.
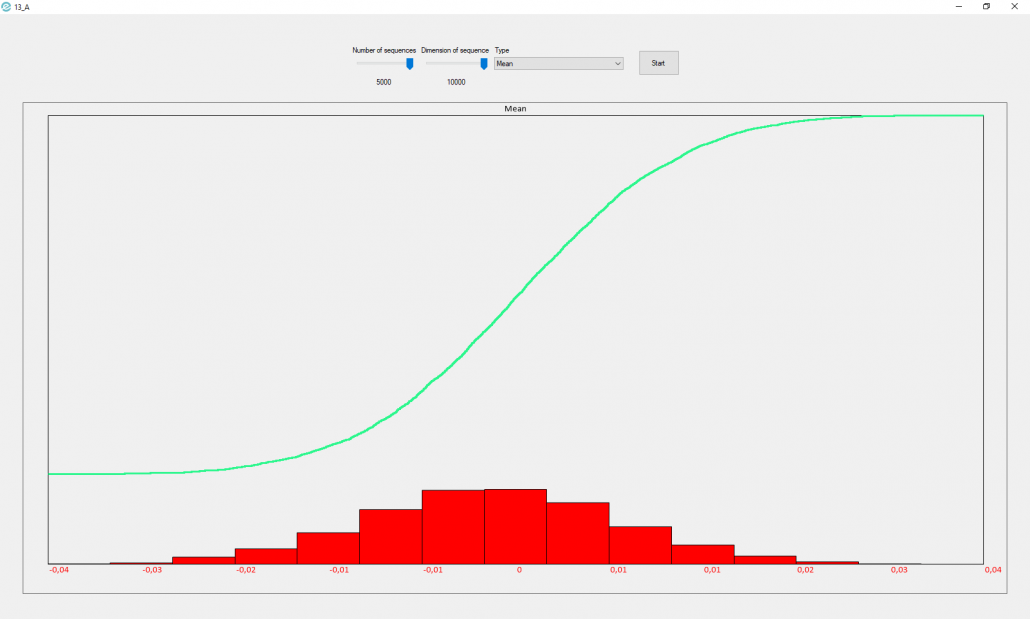
The second image represents the distribution of the mean of m sequences of n numbers generated by a normal with mean 0 and variance 1. 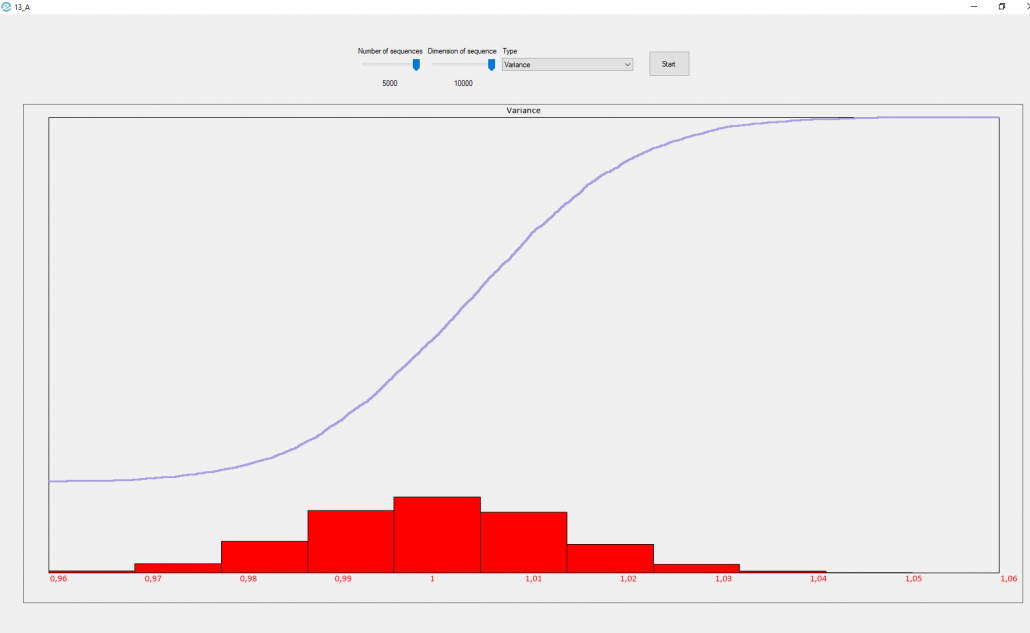
The third image represents the variance distribution of m sequences of n numbers generated from a normal with mean 0 and variance 1. 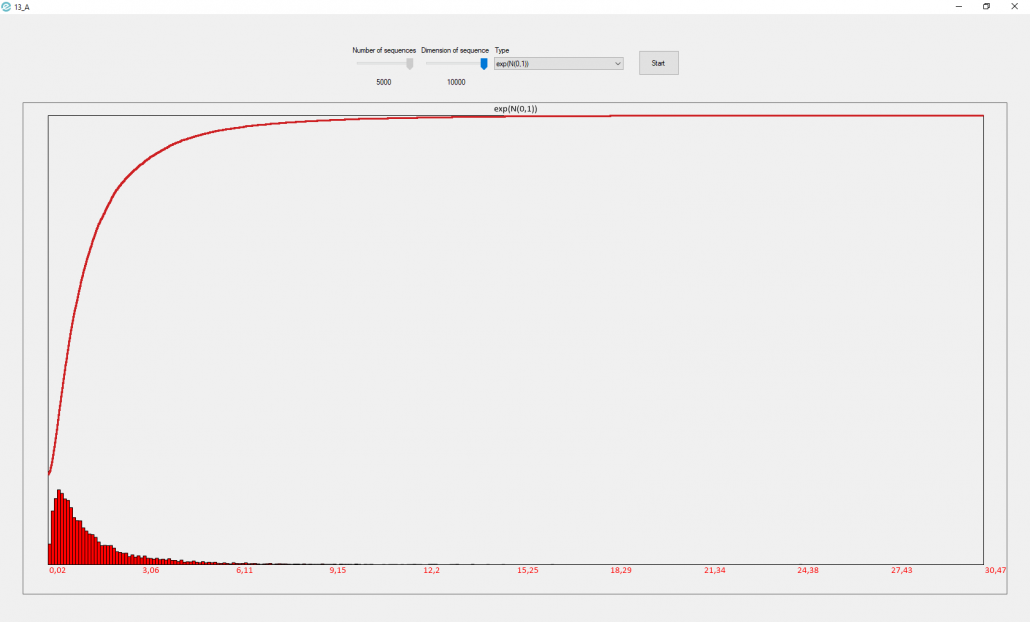
The fourth image represents the Log-normal distribution with mean  and variance
 ![\left [ exp\left ( \sigma^2 \right )-1 \right ]exp\left ( 2\mu+\sigma^2 \right )](https://emanueleseminara.it/wp-content/ql-cache/quicklatex.com-541362d76bad56b791192008b9d69e40_l3.png "Rendered by QuickLaTeX.com") .
. 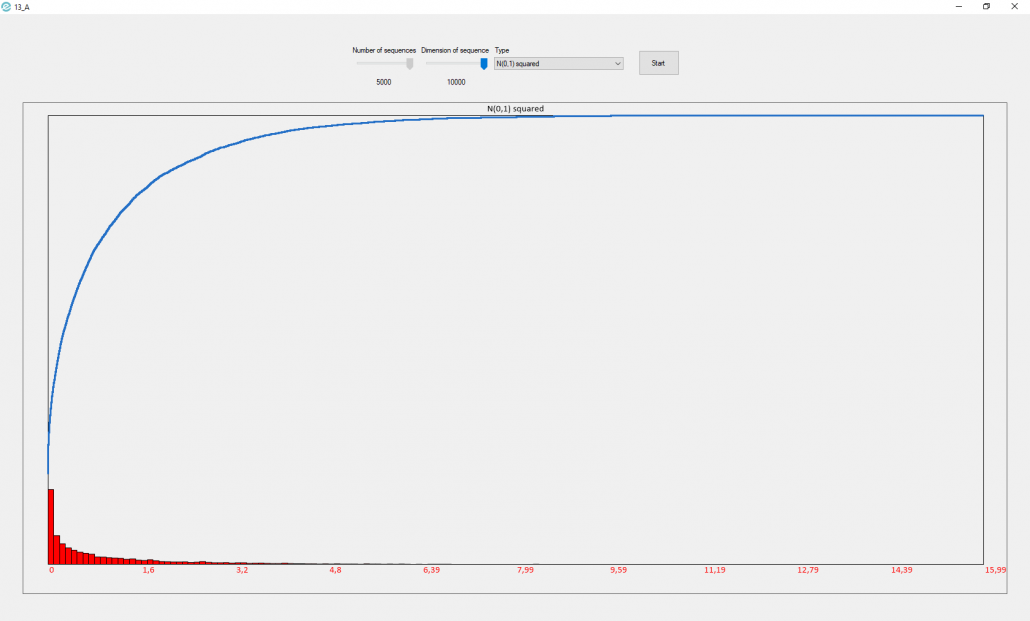
The fifth image represents the Chi-squared distribution with mean is equal to the number of degrees of freedom and variance is equal to two times the number of degrees of freedom.
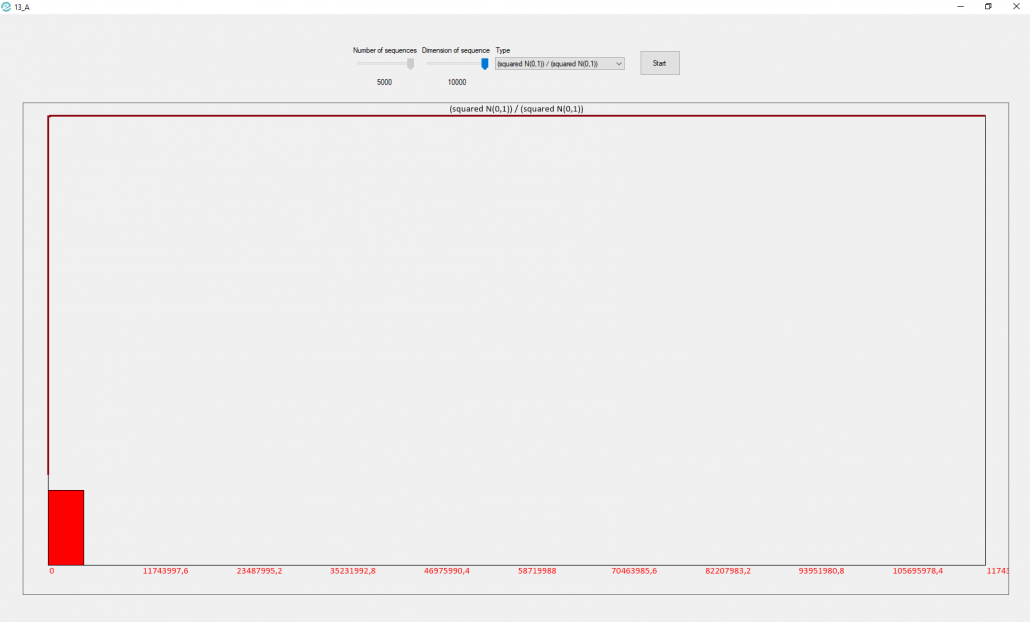
The sixth image represents the Beta prime distribution with mean  if
if  and variance
  if
if 
References
Normal distribution – Wikipedia
Beta prime distribution – Wikipedia

Leave a Reply
Want to join the discussion?Feel free to contribute!