
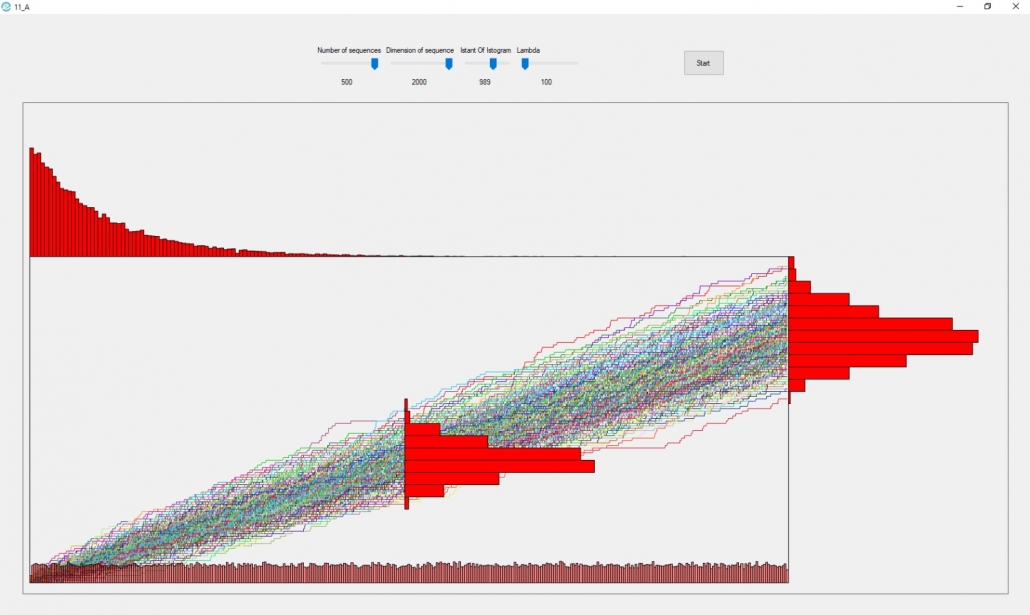
The previous graph is taken from application 11_A, as we can see the following distributions are present:
- Poisson distribution
- Uniform distribution
- Exponential Distribution
- Poisson process
A Poisson process is a model for a series of discrete events where the mean time between events is known, but the exact timing of the events is random. The arrival of an event is independent of the previous event. The important point is that we know the mean time between events but they are randomly spaced (stochastic). We could have consecutive failures, but we could also spend years between failures due to the randomness of the process.
A Poisson process satisfies the following criteria (in reality many phenomena modeled as Poisson processes do not exactly satisfy them):
- Events are independent of each other. The occurrence of one event does not affect the likelihood of another event occurring.
- The average rate (events per time period) is constant.
- Two events cannot occur at the same time. It means that we can think of any sub-interval of a Poisson process as a Bernoulli test, i.e. a success or a failure.
Poisson distribution
The Poisson process is the model we use to describe randomly occurring events. Using the Poisson Distribution we could find the probability of a number of events over a period of time or find the probability of waiting some time until the next event.
The probability function of the Poisson distribution gives the probability of observing k events over a period of time given the length of the period and the time-averaged events:

This is a little convoluted, and events/time * time period is usually simplified into a single parameter, λ, lambda, the rate parameter. With this substitution, the Poisson Distribution probability function now has one parameter:
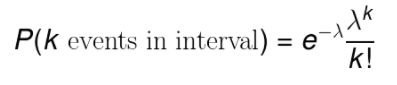
Lambda can be thought of as the expected number of events in the interval.
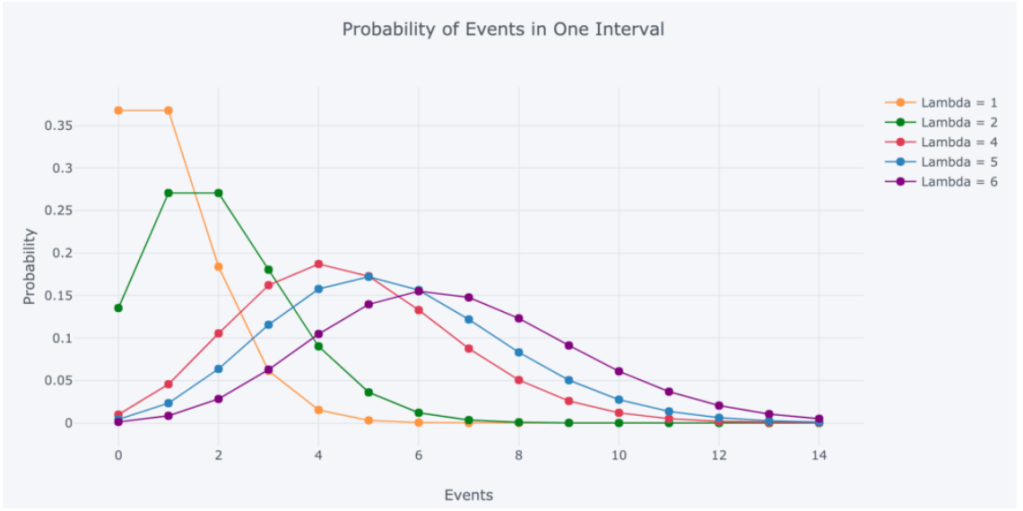
When we change the parameter λ we change the probability of seeing different numbers of events in an interval. The graph below is the probability mass function of the Poisson distribution which shows the probability of a number of events occurring in an interval with different velocity parameters.
References
The Poisson Distribution and Poisson Process Explained | by Will Koehrsen | Towards Data Science

Leave a Reply
Want to join the discussion?Feel free to contribute!