This video showing how application 6_A works in C#.
The form is composed by:
- a buttons;
- nine label;
- a comboBox;
- four trackBar;
- a pictureBox.
In the upper part of the window we can set the parameters of the number of sequences (m), of the number of points (n), of the sampling instant (t), of the failure percentage (p).
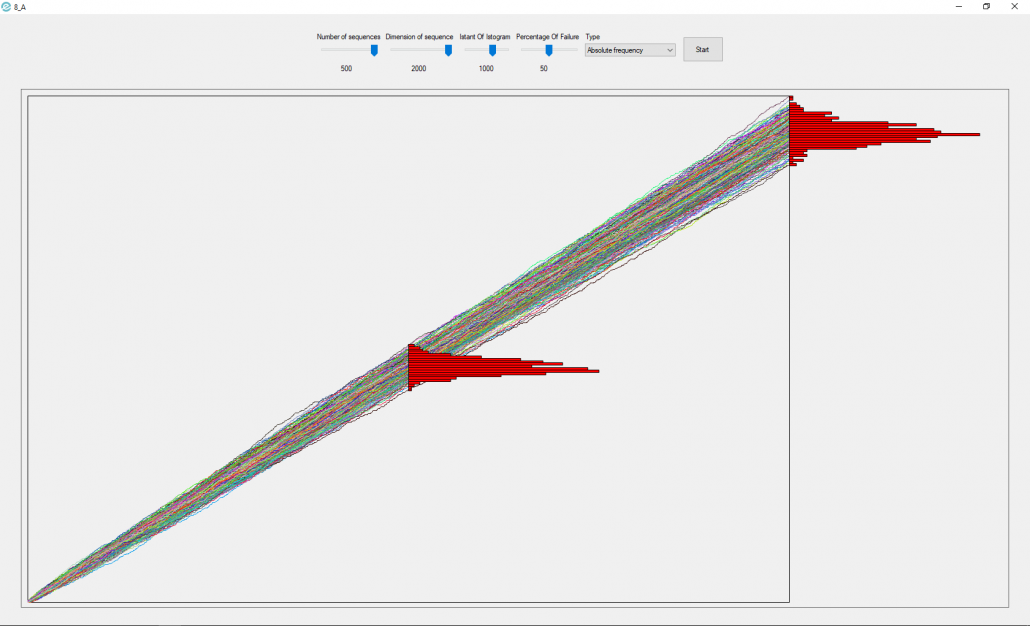
Once these parameters have been set, you can choose the type of data to be shown in the histograms. Pressing the “Start” button will generate m sequences made up of n points and shown in the pictureBox.
Absolute frequency
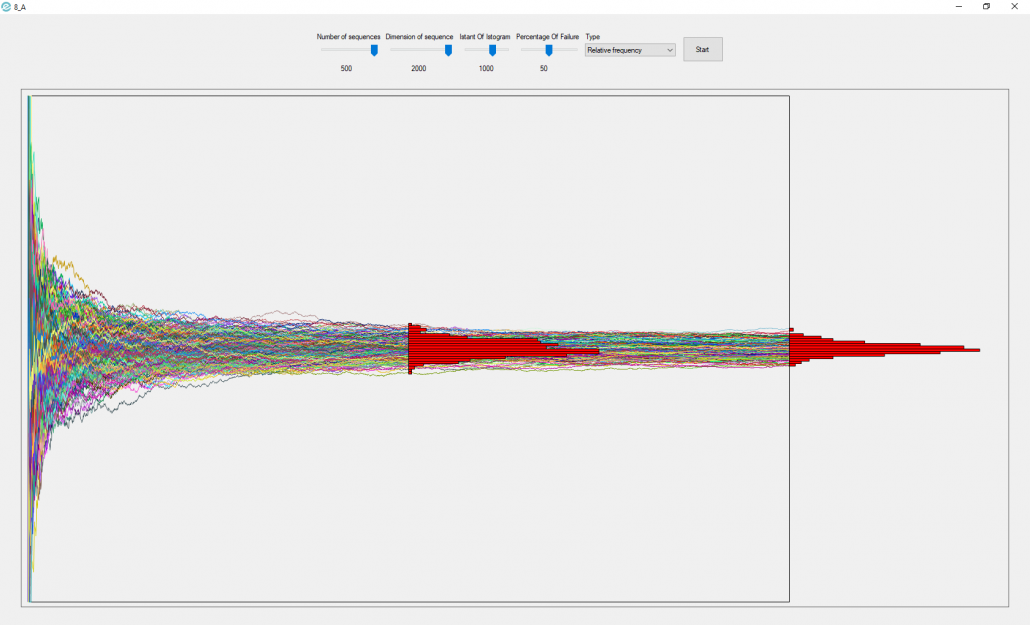
Relative frequency
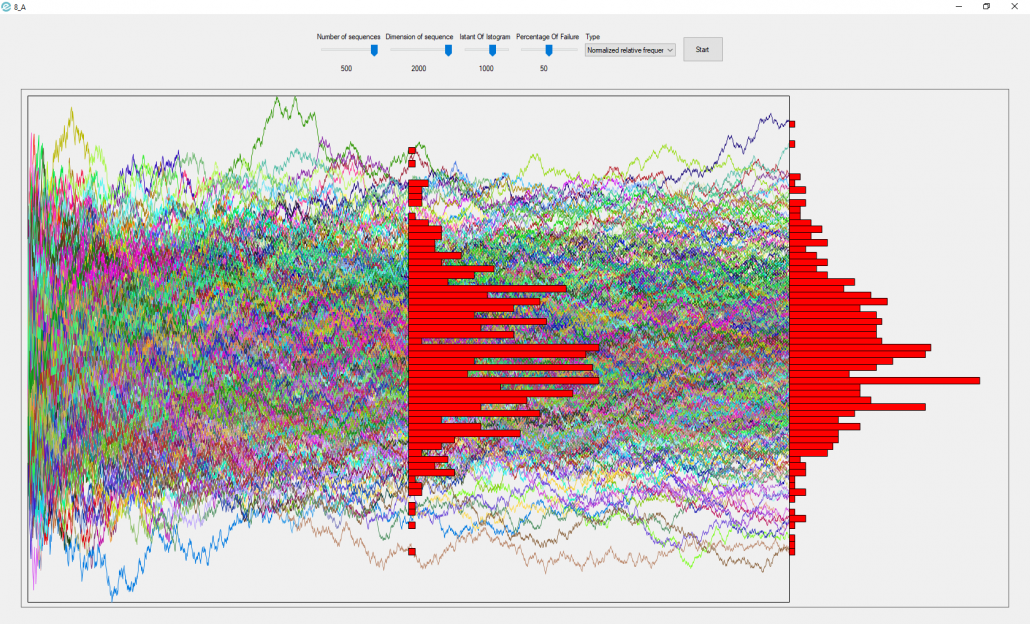
Normalized relative frequency
As we can see in the pictures, for what regards absolute frequency, with n->∞ we will have a shape that tends to zero at the tails, so it is a degenerate form.
For what concerns the relative frequency, with n->∞ we will have that ni(number of success)/n will tend to p(where p is the probability of success), and the other values will be 0 because there will be a finite number over infinity, so we will have a peak in p and it is also a degenerate form.
The normalized relative frequency, instead, is the only shape that doesn’t degenerate, and for n->∞ it tends to the normal distribution with the “bell” shape.


Leave a Reply
Want to join the discussion?Feel free to contribute!