A measure of central tendency is a single value that attempts to describe a set of data by identifying the central position within that set of data. As such, measures of central tendency are sometimes called measures of central location. They are also classed as summary statistics. The mean (often called the average) is most likely the measure of central tendency that you are most familiar with, but there are others, such as the median and the mode.
The mean, median, and mode are all valid measures of central tendency, but under different conditions, some measures of central tendency become more appropriate to use than others. Below, we will look at the mean, mode, and median, and understand how to calculate them and under what conditions they are most appropriate to be used.
Mean (or Avarage)
The (arithmetic) mean, or average, of n observations x_bar is simply the sum of the observations divided by the number of observations; thus:
![\[\bar{x}=\sum \frac{x_i}{n}\]](https://emanueleseminara.it/wp-content/ql-cache/quicklatex.com-950b7b3efc2307fe4e3744ee34bd1bda_l3.png "Rendered by QuickLaTeX.com")
In this equation, xi represents the individual sample values and Σxi their sum.
Median
The median is defined as the middle point of the ordered data. It is estimated by first ordering the data from smallest to largest and then counting upwards for half the observations. The estimate of the median is either the observation at the center of the ordering in the case of an odd number of observations or the simple average of the middle two observations if the total number of observations is even.
There is an obvious disadvantage, the median uses the position of data points rather than their values. That way some valuable information is lost and we have to rely on other kinds of measures such as measures of dispersion to get more information about the data.
Mode
The third measure of location is the mode. This is the value that occurs most frequently, or, if the data are grouped, the grouping with the highest frequency. It may be useful for categorical data to describe the most frequent category. The expression ‘bimodal’ distribution is used to describe a distribution with two peaks in it. This can be caused by mixing populations.
Distance
The measures of central tendency are not adequate to describe data. Two data sets can have the same mean but they can be entirely different. Thus to describe data, one needs to know the extent of variability. This is given by the measures of dispersion. Is important because the smaller the dispersion, the more realistic the data. But to calculate the dispersion we have to define the distance.
In mathematic terms the distance is a numerical measurement of how far apart objects or points are; a distance function or metric is a generalization of the concept of physical distance; it is a way of describing what it means for elements of some space to be “close to”, or “far away from” each other.
In machine learning, a distance measure is an objective score that summarizes the relative difference between two objects in a problem domain. Most commonly, the two objects are rows of data that describe a subject (such as a person, car, or house), or an event (such as a purchase, a claim, or a diagnosis).
In Statistics, distance is a measure calculated between two records that are typically part of a larger dataset, where rows are records and columns are variables.
There are different kinds of distances:
1. Euclidian Distance :
It is a distance measure that best can be explained as the length of a segment connecting two points. The formula is rather straightforward as the distance is calculated from the cartesian coordinates of the points using the Pythagorean theorem.
![\[D(x, y)=\sqrt{\sum_{i=1}^n (x_i-y_i)^2}\]](https://emanueleseminara.it/wp-content/ql-cache/quicklatex.com-67b4d5709eb12fed6e00f6e67f6c196e_l3.png "Rendered by QuickLaTeX.com")
Euclidean distance works great when you have low-dimensional data and the magnitude of the vectors is important to be measured.
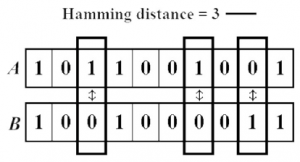
2. Hamming Distance:
Hamming distance is the number of values that are different between two vectors. It is typically used to compare two binary strings of equal length. It can also be used for strings to compare how similar they are to each other by calculating the number of characters that are different from each other:
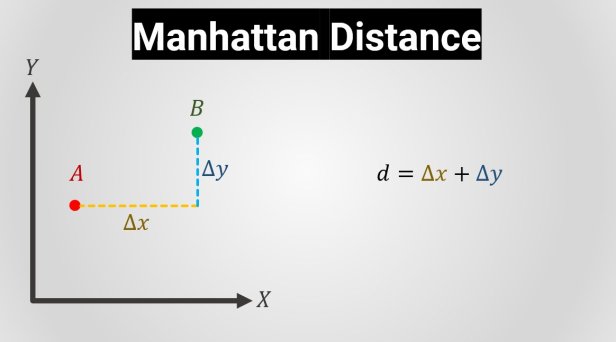
3. Manhattan Distance:
The Manhattan distance calculates the distance between real-valued vectors. Imagine vectors that describe objects on a uniform grid such as a chessboard. Manhattan distance then refers to the distance between two vectors if they could only move right angles. There is no diagonal movement involved in calculating the distance:
All these distances can be used in different subjects such as machine learning, data science, mathematics; but obviously, they will give different results because each of them has a different declaration of distance.
References
Measures of Location and Dispersion and their appropriate uses | Health Knowledge
Distance – Statistics.com: Data Science, Analytics & Statistics Courses
4 Distance Measures for Machine Learning (machinelearningmastery.com)


Leave a Reply
Want to join the discussion?Feel free to contribute!